We worked with the Roundhouse Trust to evaluate the impact of their work supporting young people to acquire digital and radio skills to develop their portfolios in broadcast and film, and to guide future direction to maximise impact.
What we did:
Community engagement
Evaluation
Research and insight
Social return on investment (SROI)
The mission.
Evaluating impact
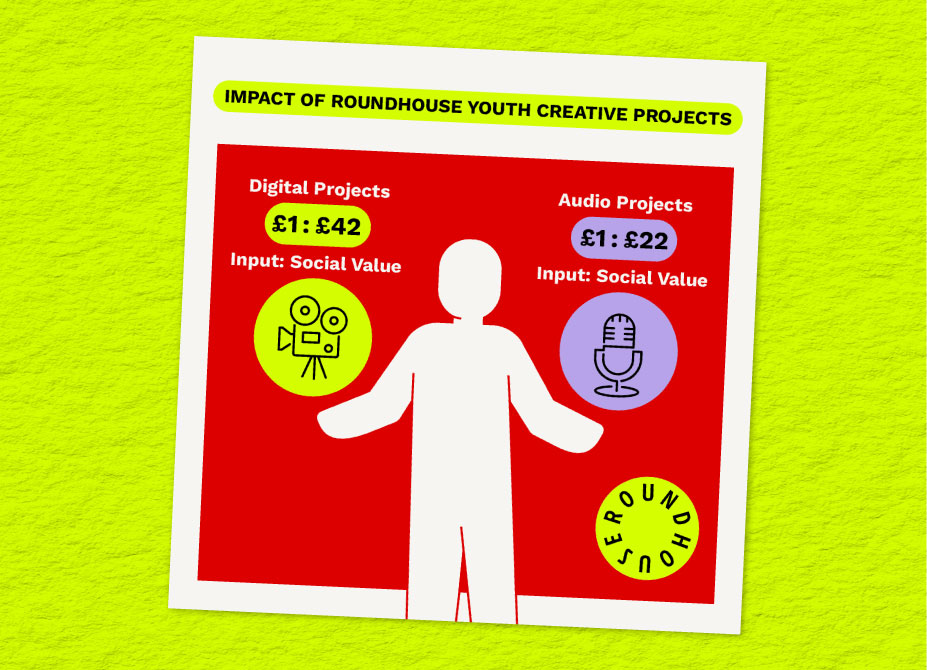
In order to help Roundhouse improve and develop their youth creative programme, Social Change carried out a Social Return on Investment (SROI) evaluation with their stakeholders. SROI is an approach that uses financial proxies to represent social value created and destroyed by target activities, in monetary terms. Our mission was to evaluate the impact of Roundhouse Digital and Audio projects for young people who are NEET status (not in employment, education or training).
The research.
Calculating SROI
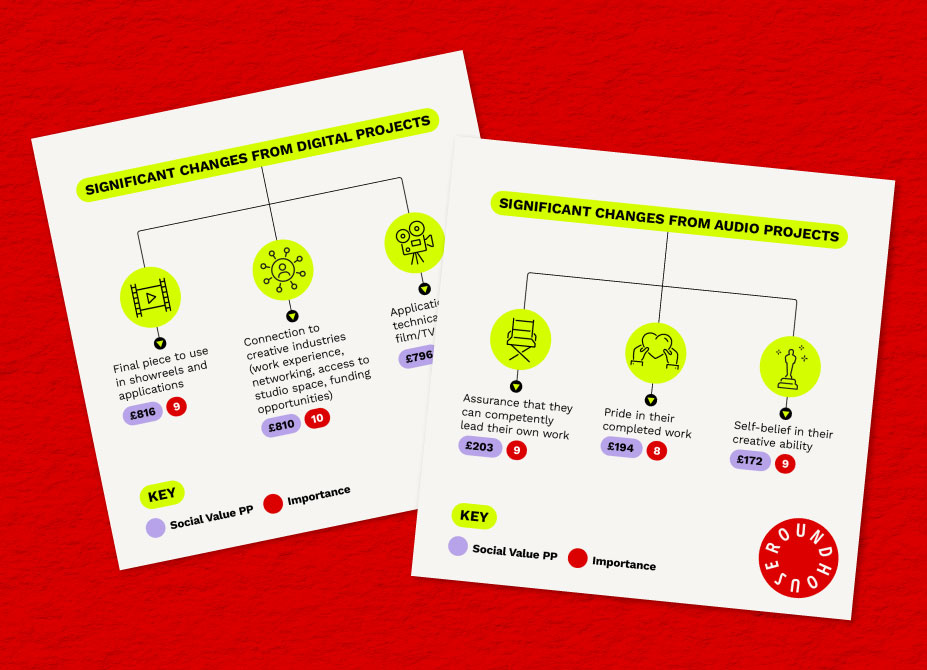
Through numerous quantitative and qualitative consultations with stakeholders including surveys and interviews, we gained an understanding of the outcomes young people gained from taking part in Roundhouse creative projects. Whilst calculating SROI for each of the two project strands, the data was continually assessed according to the core Principles of SROI to ensure a robust evaluation of the project activities.
What we did.
Maximising value
To present SROI findings, we created a summary report and visually engaging infographics to communicate the impact of Roundhouse projects. The findings will support Roundhouse to optimise their activities and maximise the value they create for young creatives and the creative industries. This research may help to drive input and focus towards outcomes which are high value or most important to stakeholders. Now, Roundhouse can continue to deliver unique creative and personal development opportunities to young people through their Broadcast and Digital Programme, with a refined understanding of how to maximise positive impact on those individuals and the creative community.
From identifying the activity or intervention you intend to measure, to understanding its scope, our Defining Your Needs Guide will help you to create and develop the building blocks for a SROI analysis.
When it comes to measuring the impact of investments, there are two main approaches, depending on your focus: Return on Investment (ROI) and Social Return on Investment (SROI). By understanding the key differences between ROI and SROI, businesses can choose the most appropriate approach for their needs and ensure that they are getting the most out of their investment. Download our ROI vs SROI guide to understand more about the two types of investments.
Wondering what Social Return on Investment (SROI) is and how you can apply it to your business? Download our whitepaper today to understand if SROI is right for you.