Data Analysis: Understand your audience like never before
Do you collect customer data, but have no idea what to do with it? We can help you turn data into decisions by extracting useful behavioural insights to help you understand how to influence and respond to customer behaviour.
We can take your data and our knowledge of behavioural science to go beyond demographics and ‘claimed’ behaviours to truly understand what drives human behaviour. We can uncover the patterns, preferences, and motivations that drive your audience, helping you tailor your strategies to maximise engagement and improve stakeholder experiences.

Our data analysis services
Customer Journey Analysis
Discover how customers interact with your business across touchpoints. We map and analyse the customer journey, identifying key moments of engagement and areas for improvement.
Segmentation & Profiling
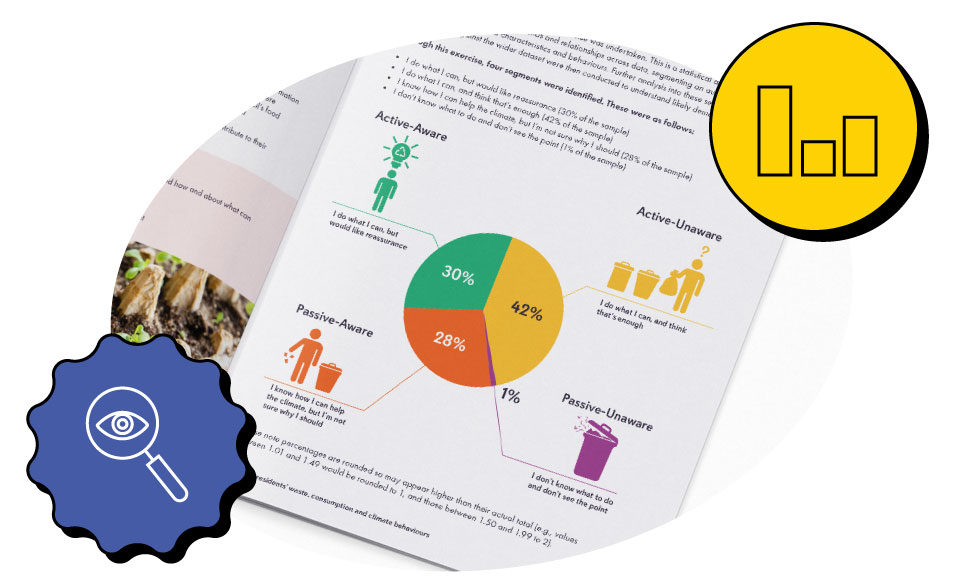
We can break down your audience into meaningful segments based on attitudes, behaviour, values, and demographics.
Engagement & Retention Analysis
We can help you identify what keeps your customers coming back [or not]. We analyse engagement metrics and behavioural trends to reveal factors that drive loyalty and retention, helping you design strategies that will reduce churn.

Actionable insights
We use advanced analytical techniques like clustering, regression analysis, and machine learning, alongside behavioural theories to ensure your insights are based on robust, reliable data.
Data Visualisation: Transform your data into powerful visual insights
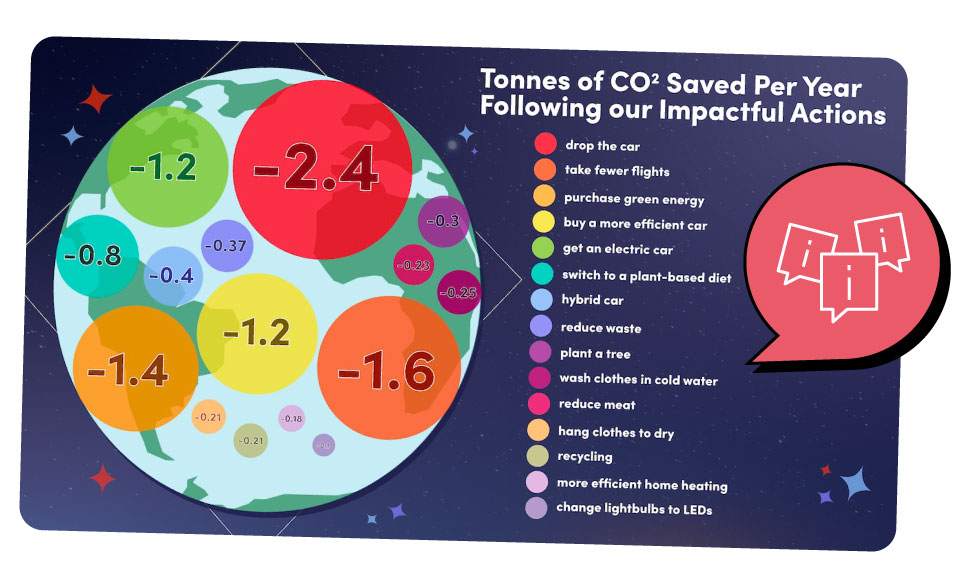
We turn data into visually engaging content. Whether you're looking to share compelling insights with stakeholders, or enhance your reports, we provide customised visualisations that bring clarity to complex data.

What We Offer
Tailored visual solutions
We bring data to life by creating intuitive, easy-to-understand data visualisations and infographics.
Interactive dashboards
Explore your data with interactive dashboards, enabling you to filter, drill down, and make sense of the details behind the numbers.
Data storytelling
Transform raw data into a compelling story that speaks to your audience, making insights more accessible and impactful.

Why Choose Us?
Expertise across industries
With experience in finance, healthcare, retail, and more, we know how to translate data into meaningful insights, no matter your sector.
Cutting-edge tools
We utilise the latest technology, including Power BI, Tableau, and Adobe products to create dynamic, visually appealing charts, graphs, and maps. We also use AI and machine learning.
Fast turnaround
We ensure every project is delivered on time, without compromising on quality.
Ready to find out what we can do with your data?
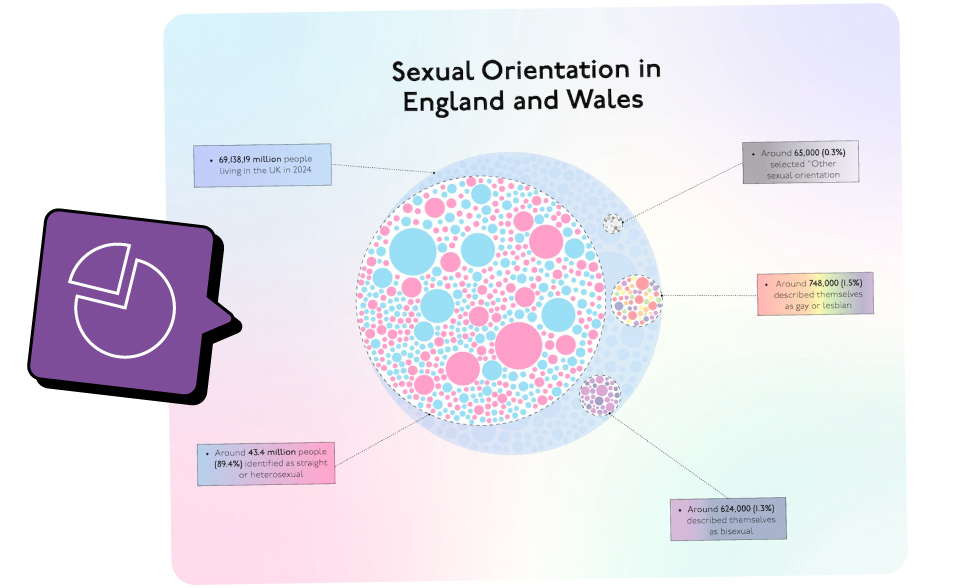
We can help you communicate hard to understand statistics in a simple, easy digestible format.
Book a consultation today and discover how our data analysis and data visualisation services can help you unlock the behavioural insights that drive growth and success.

