COVID-19 insight campaign
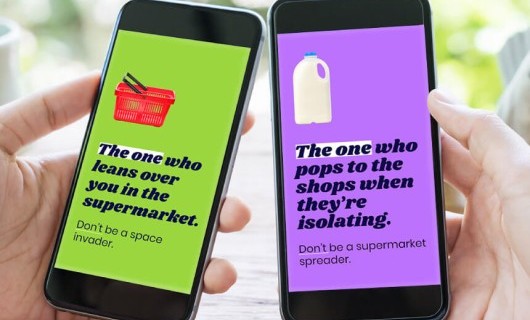
Working with Public Health Berkshire, we conducted insight research to inform a campaign to encourage adherence to COVID-19 guidance.
More +
It has never been more important for local authorities and their public health teams to communicate COVID effectively to help people navigate this "new normal".
The residents of Berkshire were seeking out information about COVID to help them navigate this “new normal”. The shared public health team in Berkshire asked us to help them create a digital dashboard that brings together all the important data on an interactive user-friendly digital page.
It was widely accepted that information was not as clear and transparent as it could have been. Our research found that many people were confused about what they could and couldn't do [especially in areas that were experiencing ‘local lockdowns’]. Those who were trying to communicate information felt that they didn't have the data available in ‘one place’ to be able to communicate clearly about what was happening in their local area.
We worked with Public Health Berkshire to develop a digital platform that helped to clearly communicate important information to residents.
The dashboard used key UX and UI design principles to present the data in a simple yet informative way. Keeping the user at the heart of this project, we approached this brief with the aim to simplify current user journeys and provide information to the public in a clean and simple way, bringing everything they need into one place; communicating important COVID data and information clearly and effectively.
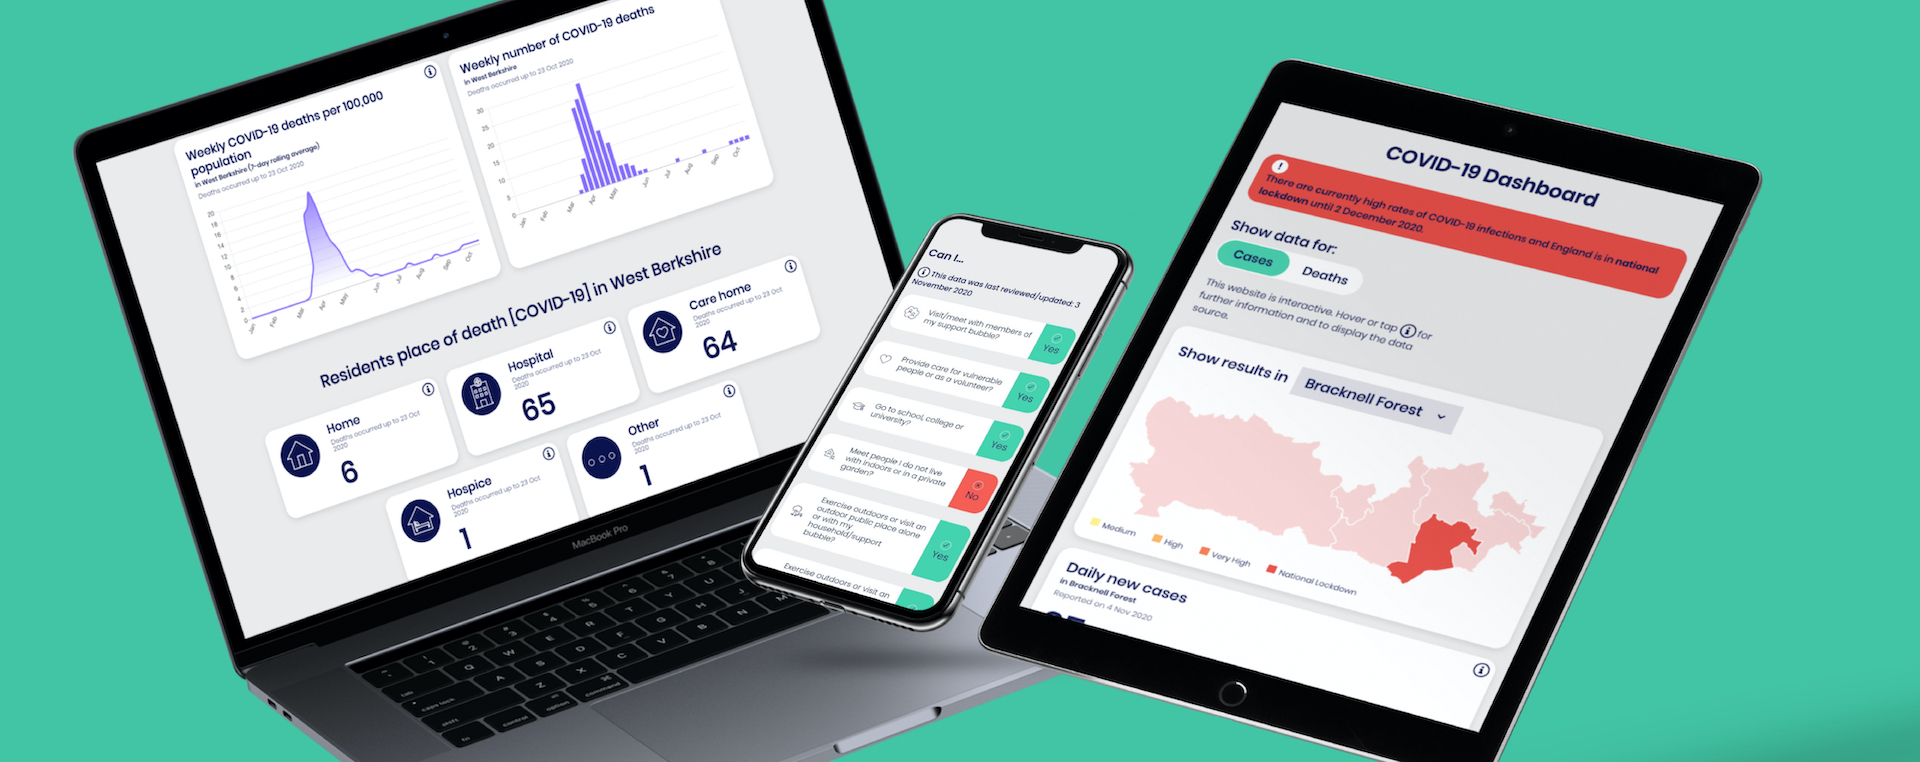
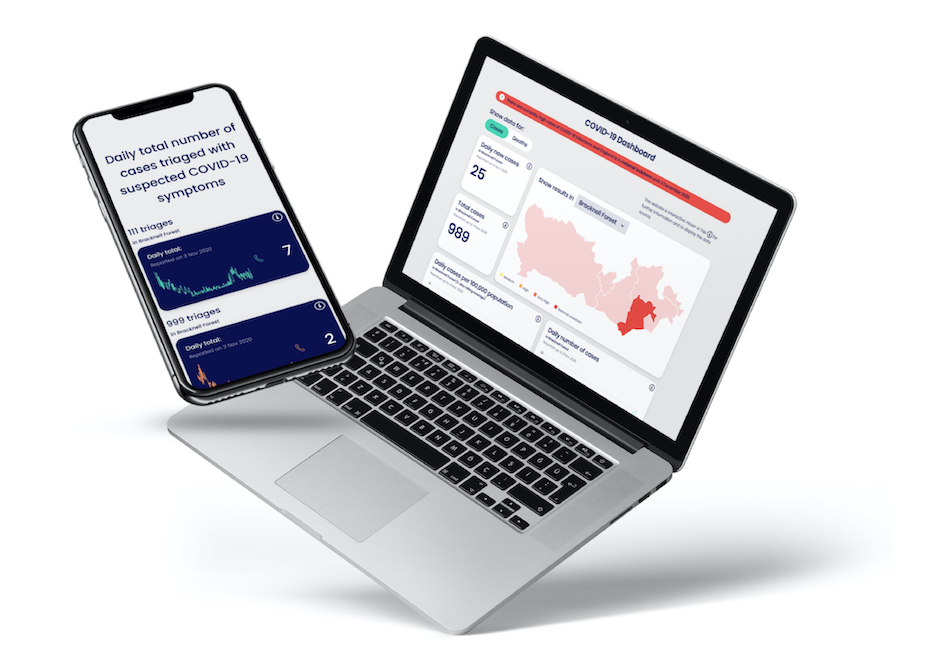
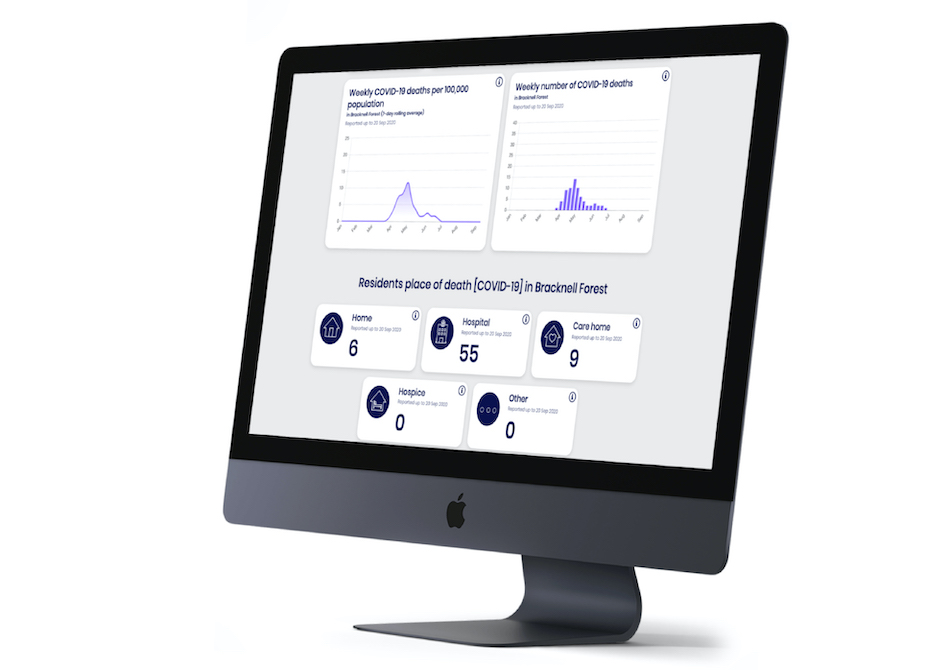
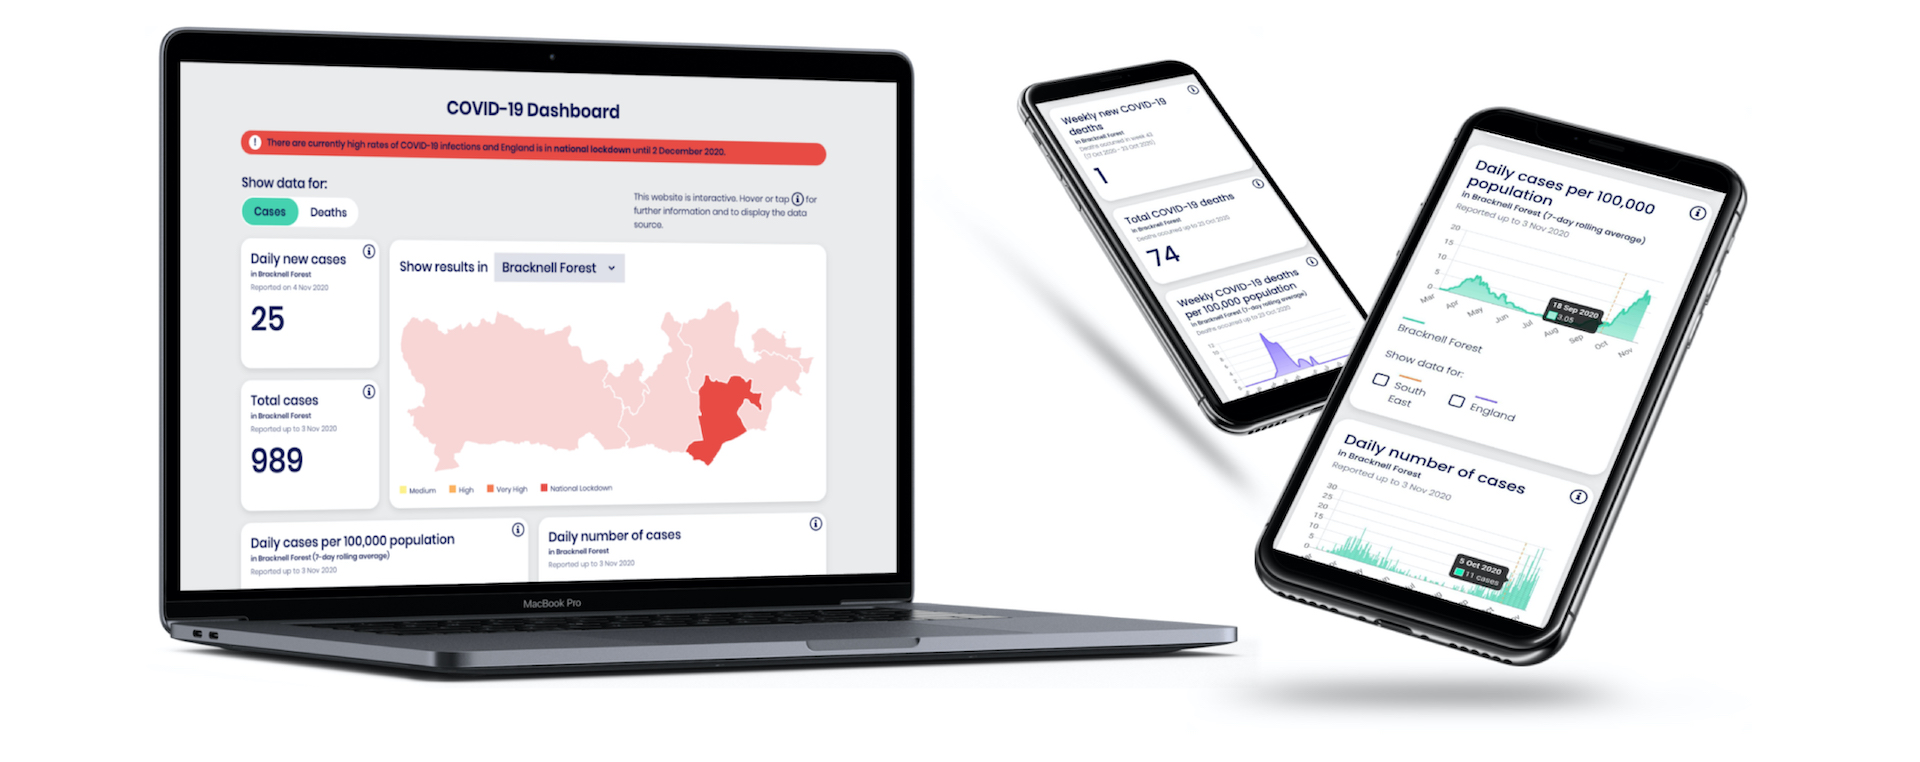
The digital dashboard.
We developed a digital dashboard to bring all of the data into one place to communicate clearly what is happening in their local area.
The dashboard displayed:
We developed a simple, user-friendly Content Management System [CMS] for public health professionals to use. We have built a tool that allows you to upload new data which will override the API integrations and allows the Berkshire team to have complete control over their data. Our algorithms also do some of the important calculations, freeing up public health team time.
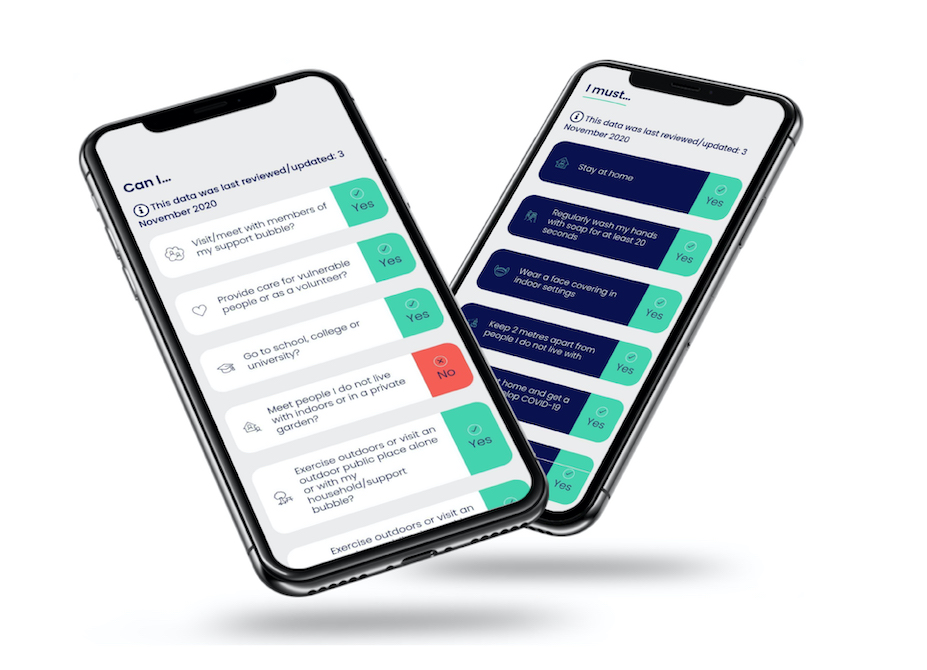
Helping people to navigate the rules and restrictions
We have developed a tool to help people understand what they can and can’t do in their local area.
Residents are able to enter their postcode to see clearly what COVID alert level they are in, and what they can and can't do - answering the many questions people have about how the restrictions impact their lives. This is stronger than the current offer from the GOV.UK site which only provides your alert level. Our tool answers the 'and so what' question.
Using our simple CMS, Berkshire can move their areas into different levels and also control the restrictions, allowing them to switch on and off the different things you can and can't do. This gives complete control to the local area and provides clarity for the residents of Berkshire.
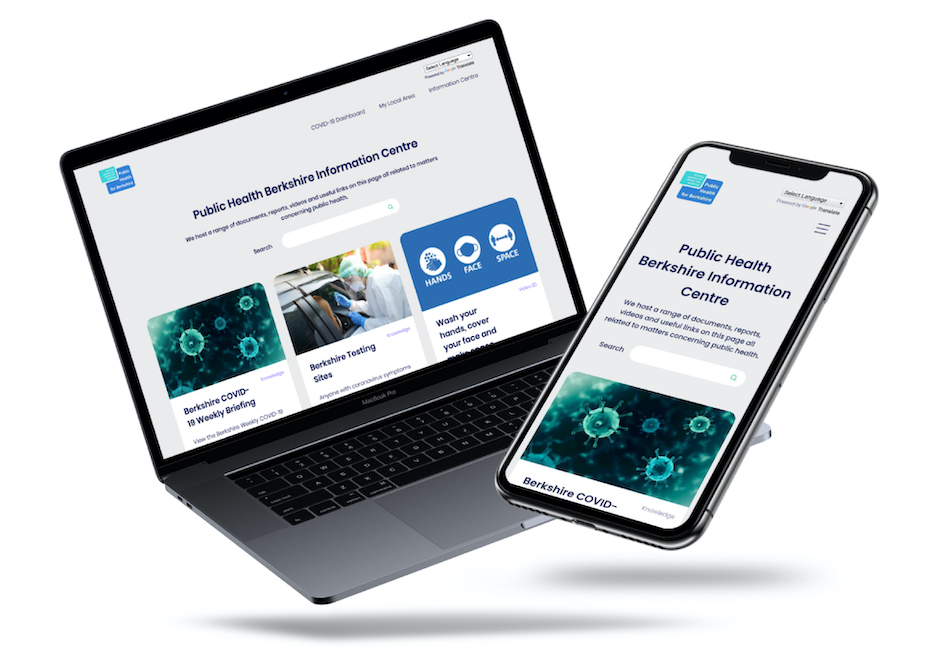
The Berkshire Information Centre posts important information relevant to COVID-19 such as announcements, videos, downloads and press releases. This is a 'one stop shop' which simplifies the process and communicates information from one core place, instead of multiple teams and across multiple websites.
In the future when COVID is over [we hope!], this website will be turned into an interactive space for local information and intelligence such as displaying obesity rates, mental health data and alcohol admissions.
Working with Public Health Berkshire, we conducted insight research to inform a campaign to encourage adherence to COVID-19 guidance.
More +
Alcohol consumption is changing under coronavirus and lockdown measures, for better and worse. We explore this research and review the factors influencing changes in alcohol consumption.
More +By entering your email address, you agree to be added to our mailing list.
We respect your privacy.
We never sell data.
Unsubscribe anytime.